Friday, July 4, 2008

The (Fantasy !?) World of the UK Government

This BERR report (small pdf) published in May 2008 provides 4 alternative price scenarios for oil, natural gas and coal. The high scenario is shown below.


BERR are inviting comments and suggestions.

emissionsprojections@berr.gsi.gov.uk

Upstreamonline is a good source of oil and natural gas prices.

On 3rd July:
Brent is trading at $144 per barrel
Tapis is trading at $153 per barrel
UK day ahead natural gas is trading at 62p / therm

Some comments:


LOL.

Actually, I think they are wasting our taxes - 'fiddling while Rome burns'.

We are half-way through 2008 and the average price, to date, for Brent must be ~$115 already above the high-high prediction for 2010.

To be in error by such a wide margin in two months is pathetic - I am easily able to predict the actual price within ~$10 in that timeframe (the average moves even less), oil is trading in an escalating range, look at the graph on the Upstream site Euan links to, join all the high points with a curved line and join all the low points with a curved line and extrapolate both two or three months.

In reality nobody knows the future and predictions such as these are of no use to anybody. Best for BERR just to admit it and sack everybody involved and use the money saved to insulate poor housing stock.

What truly amazes me about the assumptions behind the predictions is that no allowance is made for reducing CO2 - all we see is IEA predicted growth despite the Government signing us up to binding severe CO2 reductions.

Quoted market prices for calendar year 2009 as of 13:30 on 3rd July:

Brent $147.95 per barrel (175% x "high scenario 2010", 138% x "high high 2010")
ARA Coal (API2)$205.50 per mt (360% x high scenario 2010, 178% x "high high 2010")
UK nat gas 101.00 pence/therm (187% x high scenario 2010, 151% x "high high 2010")

My only suggestion to BERR is that if they intend to publish the report for mass market consumption, they should do so in a joint venture with Andrex so that the report will at least have some utility.

<>This clearly illustrates some of the dire consequences of the unbalances between energy supplies and demand, predictability completely vanishes.

Institutional forecasts are used by many public and private sectors for their long? term planning. With the kind of input now provided by many institutions expect to see some astonishing results.

The world we are headed for will be defined by a completely, and as of now poorly understood, new set of rules.

<

In their high-high scenario they say :
"In the high-high price scenario, strong oil demand, a lack of investment and a fast decline in spare capacity is assumed to drive prices upwards until the point of demand destruction—when alternative energy sources become competitive and oil consumption declines. The oil price is then assumed to remain around this point in the long-term."

We can see in the high-high scenario the price stabilising in 2015 at 150 $

So they assume two things

-alternative energy will succesfully replace oil since the price of oil will not rise further when they will be used.
-They will be used on a large scale (to replace oil) at 150$ for some mysterious reason

Well we will soon see if their previsons are correct, maybe in a few days..........

Wednesday, June 25, 2008

A State of Emergency


Click all charts to enlarge, without call out.

This BERR assessment (960 kb pdf, 58 slides) of oil and gas production on the UK continental shelf arrived in my mail box last week. It is one of the best summaries I've seen and should be read by all with an interest in the future of UK and European energy security. The chart above is based upon the BERR forecast for UK oil and gas production. It is time for Alistair Darling and Mervyn King to explain to the British people why they see current problems with energy prices and associated inflation as a transient blip when the UK seems to be in a terminal dive towards insolvency.

Methodology

The bar-charts are prepared from the BERR forecast shown below (slide 57 of the presentation). United Kingdom continental shelf (UKCS) production of oil and natural gas are forecast to continue their decline from their respective production peaks in 1999 and 2000. The decline rate is not given, but it appears to be around 8% which seems about right.


Chart modified from slide 57 of the BERR presentation. Click on chart to enlarge.

Historic oil prices shown on this chart are the annual average for Brent Blend taken from the BP statistical review of World Energy 2008. This year to date (YTD) is about $110 and the forecast uses an annual rate of increase of oil and gas prices of 25% per annum. It is of course near impossible to forecast future oil and gas prices, but with international demand for oil and gas continuing to rise against near static supply, the trend of increasing prices seen in recent years seems set to continue.

BERR forecasts consumption of oil and gas to remain relatively flat. This seems a reasonable first order assumption to make. However, in the real world, escalating fuel and domestic energy costs will lead to widespread conservation. The well-off will insulate their homes and buy more fuel efficient cars. The poor will switch off their heating and take the bus. It is near impossible to forecast the scale of energy demand destruction that will take place in the UK.

Oil and gas are assumed to have equivalent price. Millions of tonnes of oil equivalent are converted to millions of barrels by multiplying by 7.33.

From riches to rags

The bar chart up top indicates the cost of importing oil and gas to the UK ballooning to about $200 billion (£100 billion) per annum by 2013 - just 5 years away. This completely dwarfs the riches of North Sea oil and gas production the UK enjoyed up to 2004, which were exported at rock bottom energy prices. The chart is indicative since it is unlikely that this will ever come to pass. It is unlikely that the UK will be able to source or pay for this ever rising energy bill on the international markets.

Left to market forces, the problem will be solved by spreading energy poverty throughout the UK population. The wealthy who can afford the small amount of expensive energy on offer will be fine whilst the poor will just have to go without - personal transport, heat, light and power.

The charts below show the gross cumulative and per capita cumulative surplus / deficit from 1998 which is when the BERR chart begins, which coincides roughly with when the New Labour government (Blair - Brown) came to power. We are currently at the fulcrum of surplus turning to deficit. By 2013, the UK may well run up a cumulative deficit in oil and gas imports in excess of $500 billion - if we can find countries that will sell us oil and gas on credit. This equates to an energy debt over $8000 for every man, woman and child in 5 short years. This is in addition to the already dreadful debts we have run up as a country importing consumer goods on credit (see below).


Mervyn King, Governor of the "independent" Bank of England;-)

Gordon Brown, the most confused man in the world? On his way to Saudi Arabia to beg for more oil to combat global warming whilst promising a green energy revolution at home founded on nuclear power.
Population data from The United Nations.

A state of emergency

We should hopefully by now have reached a point where all stake holders in UK, European and Global energy are able to grasp the simple fact that we are now in the early stages of a full blown global energy crisis. The focus is currently on oil but this will soon turn to concerns over natural gas and coal supplies.

This crisis has been turned into a state of emergency by the indifference of political leaders in the UK (and throughout the world), fluttering in the wind of poorly informed public opinion while they have prevaricated about expanding renewable energy resources and building new nuclear power stations. All warnings of this pending energy crisis have been ignored in favor of pursuing popular policies that created the illusion of prosperity whilst the fundamentals of our nations security and well being have been draining away.

The chart below shows the current state of the UK trade balance. This is the position at the end of the good times North Sea oil and gas have provided. The situation now is about to get a whole lot worse as our energy surplus turns into a crippling deficit with no plan on the horizon of returning the books to balance.


Data from National Statistics Online, table 5050646091.csv, column ikbj.

I have not attempted a forecast since some major changes to UK trading status are to be expected. Higher food, fuel, domestic energy and bank interest bills will squeeze the disposable income of many individuals and families. Thus, instead of buying consumer goods and going to Spain on vacation, families will instead spend this money on food and energy. Thus we can expect the deficit in goods and tourism to reduce while the deficit in energy balloons.

The future

The exchange last week between Mervyn King (Governor of the Bank of England) and Alistair Darling (Chancellor of the Exchequer) suggests that they plan to do nothing about this presuming that the upwards tick in energy and food prices (that began in 2002) will drop out of the annual inflation statistics a year from now. True rabbits caught in the headlights. They have created a perilous situation for the UK economy that they seem not to understand let alone know how to fix.

Here are a few pointers to what I think we can expect in the next 18 months:

  • Forever rising energy import bills will pressure Sterling which will continue to fall, pushing up the cost of energy, food and consumer goods even more.
  • Public sector workers, no longer able to borrow to supplement income will begin to strike once they discover that 3% wage increases do not come close to covering the rise in the cost of living (the great inflation lie will be found out).
  • Unemployment will begin a steady rise as financial services, banks, building sector, airlines, airports, leisure and retail come under severe pressure. They will be joined by public service workers as the government struggles to fund public services with falling tax receipts, spiraling debt and a falling pound. (already happening in Aberdeen with deep cuts in education spending across the city and teacher numbers being slashed).
  • I won't go into the spiraling and compounding nature of this on the property market since this is an article about energy.
  • The elderly and poor will really struggle this winter to pay their energy and food bills. If the weather is cold, the grid might fail and the vulnerable will begin to die from cold and starvation.

Following that things will begin to get worse as the UK discovers that it is struggling to secure sufficient natural gas at any price, on the liberalised market they helped create. Society becomes more polarised into those who can still afford to drive an SUV, live in comfort and warmth and fill their bellies with prime Aberdeen Angus steak set against a new under class who struggle to feed and heat their families. Welcome to Britain in 2010.

The End

Tuesday, June 24, 2008

Why UK Natural Gas Prices Will Move North of 100p/Therm This Winter

Posted by Chris Vernon on June 24, 2008 - 9:40am in The Oil Drum: Europe

This is a guest post from Rune Likvern (nrgyman2000 on The Oil Drum). Rune is an independent energy and financial analyst from Norway who has decades of experience from holding various positions within several international oil companies and also runs a blog called "Kveldssong for Hydrokarbonar". When Rune posts on The Oil Drum we usually pay attention to what he has to say.

This post presents the development of the energy mix for UK, how UK in less than a decade went from being a substantial energy exporter to a substantial net energy importer. A more detailed look on what to expect for UK natural gas prices in the near term and a brief discussion on the real options available for future UK energy consumption.


The UK development in energy consumption and energy mix for the years 1965 - 2007 in MTOE. Click to enlarge.
(MTOE; Million Ton Oil Equivalents; 1 MTOE approximates 20 000 bbl/d (oil))
The diagram illustrates how coal in the late 60’s and early 70’s gradually was substituted with oil and increasingly natural gas in the UK energy mix. The introduction of nuclear and natural gas into the energy mix in the early 80’s is based on a combination of factors based on lessons learned during the oil embargo in 1973. The use of oil became more efficient and natural gas, due to adequate indigenous supplies, and nuclear substituted oil for some electricity generation and heating.

In 2007 UK consumed close to 2% of the global total primary energy consumption.

There are few countries where natural gas constitutes such a huge part of the energy consumption. In the recent years natural gas has made up 36 - 38% of UK primary energy consumption (in the US natural gas constitutes 25% of the total primary energy consumption). Among the countries with considerable energy consumption, only in Russia has natural gas a higher relative part (above 50%) of the total energy consumption. (Russia is now listed to have more than 25% of global remaining recoverable natural gas reserves.)

If time (and the TOD editors) permit I will in a future post look into the real possibilities of filling the emerging UK natural gas supply gap with natural gas from Netherlands, Norway, Russia and LNG which for the medium term (meaning the next ten years) seems to be the most viable future supply sources. This will be depressing reading (if you live in UK), so don’t say you were NOT warned!

The recent decline in UK oil consumption is thought to be related to the recent oil price increases. Natural gas consumption is sensitive to weather (temperature), which means heating requirements, and of course a competitive price.

I am in the process of drafting a post for TOD Europe comparing the development in energy/oil consumption and production for the G-7 countries (Canada, France, Germany, Italy, Japan, UK and US) and the BRIC (Brazil, Russia, India and China) members. One of the interesting observations from this study, so far, is that it looks like the G-7 countries oil consumption is very sensitive to relative high upward price movements of oil, like in the 70’s and 80’s and now most recently.


The UK development in energy consumption and energy mix for the years 1965 - 2007 in MTOE. Click to enlarge.
(MTOE; Million Ton Oil Equivalents; 1 MTOE approximates 20 000 bbl/d (oil))

The above diagram shows the relative development of primary energy sources within the energy mix for the years 1965 - 2007 for UK. Back in 1965 coal was the main energy source for UK delivering around 60% of the primary energy consumption. Over the years coal has gradually been substituted with mainly natural gas and nuclear and presently coal makes up less than 20% of total UK primary energy consumption.

UK FROM NET ENERGY EXPORTER TO NET IMPORTER


The development in net energy exports and imports split on energy sources for UK for the years 1981 - 2007 in MTOE. Click to enlarge.
(MTOE; Million Ton Oil Equivalents; 1 MTOE approximates 20 000 bbl/d (oil))

Through a period of 25 years the UK was a net oil exporter, which peaked with the production in 1999. 6 years later, in 2005, UK again became a net oil importer and the UK oil production from the North Sea is now generally thought to be in irreversible decline (with expected decline rates of 8 - 10% annually), suggesting future growth in oil imports if consumption stays at present levels. Even if indigenous supplies of oil are in decline, this may be overcome with a combination of increased imports and improved efficiencies in the use of oil.

The real near term challenge to UK energy supplies is identified to be natural gas supplies.

Natural gas has since the early 70’s become the most dominant UK primary energy source based upon indigenous supplies. The UK was a net exporter of natural gas (to Continental Europe) from 1995 - 2003. UK natural gas production peaked in 2000 and the UK again became a net natural gas importer as of 2004 and in 2007 UK net imports was more than 20% of its natural gas consumption.

In 1984 UK became a net importer of coal. UK coal reserves is listed to have a R/P ratio of 9 according to BP Statistical Review 2008, meaning that present reserves will last in 9 years at present rate of production.

NATURAL GAS AND OIL PRICES

It is generally observed (and acknowledged) that natural gas prices tend to follow the path of the oil prices with a time lag. Some analysts have even predicted that natural gas prices could decouple from oil prices sometime in the future.

Studying the price ratio of nat gas versus oil on a heating value basis (per million Btu) tells an interesting story.


The development in the price ratio between natural gas and oil. Click to enlarge.

The above diagram shows the development in the price ratio between natural gas and oil against the left y-axis for;

  • LNG (delivered in Japan)
  • Natural gas (cif) delivered to EU
  • Natural gas at Henry Hub (USA)
  • Natural gas at Heren NBP (National balancing Point) UK
In the diagram is also the development in the oil price shown in US$ 2007 against the right y-axis. Note how when oil prices were low natural gas based on energy content became relatively more expensive than oil and vice versa.

When the energy price ratio is below 1.0 this indicates that natural gas based on energy is cheaper than oil and vice versa when this ratio becomes greater than 1.0.

Japan seems recently to increasingly profit from the run up in oil prices as LNG purchased on long term contracts becomes relatively cheaper as a source of energy based on heat content. Developers of LNG facilities generally preferred long term contracts due to the capital intensive nature of the LNG business as this also increases the predictability for return on the investment and a steady profit flow. This is also one of the reasons why it has been challenging to establish a well functioning spot market for LNG.

Historically, and for those of the readers who are interested, 1 (one) barrel of oil has been converted to approximately 6 (six) million Btu of natural gas based on price. This means that if oil is priced at US$132/bbl, 1 million Btu of natural gas should be expected to cost US$22 at the trading point or beach.
(1 000 000 Btu = 10 Therm; 1 Therm = 100 000 Btu)

The diagram illustrates that the recent years run up in oil prices, as from 2004, have made natural gas increasingly and relatively cheaper than oil (in the diagram it can be observed how the hurricanes Katrina and Rita affected US natural gas prices in absolute terms and relative to oil in 2005). Note also how natural gas became relatively expensive as oil prices fell.

So far in 2008 the recent runs up in the oil prices have further encouraged an increase in the demand for natural gas. The result from this demand growth may now be observed in the recent price increases for natural gas at trading points like Henry Hub (USA) and NBP (UK)

Consumers who have dual fuel capabilities (like electrical power plants normally used for peak shaving) will tend to alternate between natural gas and distillates based on price.

The UK was a net exporter of natural gas form the years 1995 to 2003 (ref the diagram above illustrating the development for UK as a net energy exporter and net energy importer) and how this increased with the opening of the Interconnector between Bacton and Zebrugge in Belgium in 1998.

For UK owners of natural gas the liquid market of Continental Europe was in close reach and prices on the beach on Continental Europe was on average 20% higher than in the UK (ref the above diagram) and serving this market did not pose any big technical challenges, financial or political risks.

The lower nat gas prices at the beach for UK domestic users, both household and industrial, also gave UK industry a competitive edge (relative to consumers in Continental Europe and even in the US) and made comfortable amounts of energy available and affordable for households.

WHERE IS UK NATURAL GAS PRICES HEADED AND WHY

In 2007 the UK natural gas market became flooded with natural gas thus depressing prices. This flood of natural gas resulted from several sellers, like Norway, Holland (BBL) and LNG traders, had perceived an increased tightness in the UK market (due to declines in UK indigenous supplies and expected growth in consumption) for the heating season 2006/2007 and positioned them to reap the profits from this tightness. What happened, as these players seems to have been unaware of each other (which should be the case in an ideal liberalized marketplace), was that supply increased more than demand grew and in addition the weather became milder than normal, a combination and a recipe for depressing natural gas prices.

UK will increasingly have to cover their natural gas consumption through imports, which suggests that an era of cheap natural gas, which has also acted as a competitive edge, increasingly will have to become harmonized with natural gas prices on Continental Europe which UK increasingly will have to bid against to secure supplies. Indirectly this may now be observed as less natural gas is exported to Continental Europe in the summer months through the Interconnector.

  • With reference to the diagram showing the development in the energy price ratio between natural gas and oil and establishing a reference to 2007 levels, further assuming harmonization against natural gas prices on Continental Europe, this should suggest that nat gas prices in the UK at the beach has to come up 50 - 60% relative to 2007 levels. On average in 2007 these prices were 30 p/therm at the beach (the natural gas price has huge seasonal swings).
  • Oil prices in 2007 was on average above US$72/bbl, and so far in 2008 the average oil price has been close to US$110/bbl and recently it seems like it has found support at US$130 - 140/bbl. This now suggests that the natural gas prices should put on an additional 80 - 90%.
The above points suggest that natural gas prices on average in 2008 in UK will have to put on 150 - 200% resulting in average prices through 2008 of 75 - 90 p/therm at the beach. Recently natural gas is now trading at 60 - 65 p/therm.

It is difficult to predict the weather for the upcoming heating season and this is often the one factor having the greatest effect on short term natural gas prices. Given the seasonal nature of natural gas consumption it should come as no surprise if UK natural gas prices at the beach move north of 100 p/therm before the upcoming Christmas.

For an average household consuming 600 - 700 therm/annually (18 - 21 000 kWh/a) this would translate into an increase of the households natural gas bill of £3 - 400 this year relative to 2007.

SUMMARY

In this post it has been shown why UK households and industries should expect to increasingly be hammered by growing energy prices.

In less than ten years UK went from being a considerable energy exporter to becoming in size a similar energy importer. In 2007 UK imported more than 20% of its energy needs. This import is now forecast to grow at an annual rate of 13 - 15 MTOE (250 - 300 kboe/d; kilo barrels of oil equivalents a day) or 6 - 8% in the years ahead. What makes UK such an interesting subject from an energy standpoint is that the UK has had to transit from a major energy exporter to an energy importer with a speed never seen before for any other comparable economy. There are economies that are and have been more reliant on energy imports than UK (like Germany, France, Italy, Japan to name a few) and these have from these realities developed (seemingly) long term successful strategies involving central government’s involvement to cope with this energy reality.

This post has further shown that the UK energy mix is dominated by natural gas and thus made it vulnerable for potential future supply crunches. To revise the energy mix is a time consuming process and if the world has passed, is on or close to its apex for liquid energy supplies, these will not constitute a sustainable alternative to natural gas for the UK energy mix.

I have been informed that after a coal mine has been closed it may take ten years to recommission it for operations. Coal is mainly used for electricity generation and could of course be used for both heating and cooking purposes, which suggests changing housing appliances and stoves to accommodate this. To base the future UK energy mix on more coal results in future growth in coal imports.

Nuclear energy comes with delicate political maneuvering as the public needs to familiar itself with this alternative. Further needs nuclear plants a lead/construction time of approximately 10 years from approval have been granted.

I have not presented anything about renewables.

(I consequently refuse to use the expression “renewable energy”, as people who are familiar with the laws of thermodynamics know that energy by nature is NOT renewable. Energy may be transformed from one form into another.)

So called renewables will play a role in the future energy mix, but their impact on energy supplies must realistically be viewed against the potent and versatile nature of oil and natural gas.

Like USA talks about its oil addiction it looks like UK needs to talk about its natural gas addiction.

Given the time frame and not least options available to redesign the UK energy mix it looks like the UK “energy supply war” may have been lost before most people became aware that there was one on.

Nature enforces its own limits and a realistic look on the future energy options available for UK, energy conservation and power down now seems the most likely. This is of course a harsh message for any politician to convey to the public as it requires talent and leadership which there generally seems to be a universal deficit of......even in good times.

Thursday, June 12, 2008

Energy Prices, Inflation and Denial

Higher energy prices are feeding through to rampant consumer energy price inflation. And yet the authorities and many investment houses still see energy prices falling in the future. This naive view of global energy supplies is starving energy markets of the capital required to expand conventional and alternative energy supplies.

UK National Grid, with responsibility for the distribution of natural gas and electricity in the UK, see flat to falling natural gas prices to 2015 and beyond. Comments welcome!

Global annual average natural gas spot prices from the BP statistical review of world energy 2007. Click all charts to enlarge

[Editor's note: this story was first run on 4th February 2008]

Global gas spot prices began their sharp up-trend around the year 2000 which just happens to coincide with the year of peak gas production in the UK. Since 2000, UK gas spot prices have increased almost 4 fold and this along with higher coal and oil prices is beginning to have a significant impact upon UK inflation.

The chart is compiled from Table 2.1.1. from the report Quarterly Energy Prices December 2007 (pdf), found in the Energy Statistics section of the BERR web site. From 1990 to 2000 inflation in most primary energy sources was benign in the UK, excluding petrol (gasoline) which was deliberately inflated by progressive tax increases. Since 2003, however, inflation in gas, electricity, coal and heating oil has taken off. RPI data can be found at National Statistics Online.

Prior to 2003, price inflation in UK primary energy sources was running well below the inflation rate as measured by the RPI (the Retail Price Index is a holistic UK inflation indicator). Since 2003, inflation in all primary energy sources has taken off and for example gas prices have increased on average 18% per annum for the last three years. Prior to 2003, low energy costs had a dampening impact upon inflation but now they are running well above the RPI and this may result in inflation spreading through the UK economy since energy use impinges upon numerous goods and services.

Electricity and gas prices have just been raised significantly in the UK leading to howls of anguish from the public and the media.

The meteoric rise in UK gas demand was reversed these last two years as amongst other factors, high price has dampened domestic demand. Data from department of Business Enterprise Regulatory Reform (BERR) table 4.1.1.

Demand for gas has fallen in the UK over the last couple of years. This may be due to a number of factors such as milder winters, efficiency measures, off-shoring energy intensive industries, switching between coal and gas in power generation and demand destruction among industrial and domestic users. Higher prices and scarcity play a role in four of these five factors.

But note, even though demand has fallen UK spot prices for gas are running about double last year.

National Grid

National Grid is a UK company with responsibility for electricity and gas distribution networks. Their web site is a goldmine of data and reports on the UK domestic energy situation. The next three charts come from their Gas Transportation 10 Year Statement 2007.

The National Grid view on UK gas supply and demand is shown below. UK domestic gas supplies are forecast to fall, demand is forecast to rise and imports will rise from zero in 2003 to 80% of total demand by 2017. This complies with my own view, and is in general agreement with the official government view expressed by BERR and is repeated in many industry reports. There seems to be unanimous agreement that UK gas imports are going to explode in the coming years.

National Grid paint a sensible picture of falling UK indigenous supply of gas, rising demand and escalating imports. And yet they forecast gas prices will fall. Source is National Grid Gas Transportation 10 Year Statement 2007

Surprising then that the National Grid has forecast gas prices to fall in 2008 and then stabilise for the next 10 years. I find it truly remarkable that a strategic company such as this can foresee a yawning gap opening between UK gas supply and demand and at the same time forecast falling to stable prices. This in my opinion sends out completely the wrong message to government, consumers and to the investment community.

Beach price is presumed to be the wholesale price. Note that this is significantly lower than the spot price since much gas is sold at contract prices struck many years ago. Industrial consumers paying the lower "Interruptible" tariff will be first to have their gas turned off when supplies fail. Note that domestic users pay by far the highest price and will be last to be disconnected.

Prices are struck in 2006 pence hence discounting future inflation which the Bank of England is mandated to hold at 2% per annum. Source is National Grid Gas Transportation 10 Year Statement 2007

Whilst UK spot prices for gas have near quadrupled since 2000 the wholesale and retail prices have risen by more modest amounts of around 50% since these are cushioned by long term gas sales contracts struck at a much lower price many years ago. These have protected UK consumers from the full glare of the gas spot market but with time this position will unravel. As old contracts and supplies expire new contracts for gas will be struck at considerably higher and rising prices. It's possible the retail prices we are seeing right now are the tip of an energy price iceberg that is preparing to rip through the system.

And yet the National Grid forecast prices to fall this year whilst UK consumers have just been hit by 15 to 20% rises.

This extraordinary view on future prices from the National Grid is rooted in their forecast for future European gas supplies which shows Russian Gas, Norwegian Gas and LNG imports expanding into the future. As I discussed in my post on The European Gas Market that was updated here, Russian gas supplies may at best maintain current levels - and not double as shown by National Grid (Global Insight report), Norwegian gas production may actually fall from 2010 onwards and LNG supplies may fall well short of the import capacity that has been and is being built.

The National Grid and Global Insight paint a rosy picture of gas supplies to Europe that does not seem to take into account falling production in Russia's largest gas fields, the reality that associated gas production from Norwegian oil fields will follow their oil production down and that Global LNG supplies will only meet around 50% of import expectations. Ironically the LNG import / export capacity offset is described in a report by Global Insight (large pdf). Source is National Grid Gas Transportation 10 Year Statement 2007

The harsh reality of this situation should be self evident from the fact that UK spot prices for gas have doubled again this year. It's really time for The National Grid, The Markets and The Government to waken up.

Denial and deprivation of investment

I mention our markets here because, since I started to follow energy markets and companies in 2003 the expectation for the future has always been that prices will fall - even though energy futures prices switched to contango.

This century, energy companies have bought back stock on an unprecedented scale whilst contemplating their corporate navels and avoiding real investment in future energy supplies. No wonder then that energy supplies are waning and prices are going through the roof.

Energy companies like BP find their stock valuations languishing at the same level of Jan 2005 and trading on a lowly PE multiple of 9 times historic earnings despite the meteoric rise in oil and gas prices over the same period. Whilst it is true they are struggling to grow production and reserves they have also done all they can to talk down future energy prices and to avoid investing in our energy future. The market is pricing in a future fall in production and oil price and terminal decline of global energy companies like BP at a time when we need these companies to display creativity, imagination and leadership.

The chart is from Yahoo. Disclaimer - I do not own any BP stock though I do invest in energy companies.

When an energy sector presides over falling production whilst forecasting prices for their product will also fall it is little wonder that their stock values are priced in the bargain basement of Global Stock markets. It is high time that the energy industries, capital markets and governments recognise that falling production and rising demand are not compatible with falling prices and that they come together to invest this profit bounty in our energy future. That future does not lie in low eroei liquid fuels like ethanol and syncrude but in solar energy, wind energy, electricity, batteries, electric transportation and global scale HVDC grids.

It is time to invest and build.

Previously on The Oil Drum

UK Gas and Electricity Prices by Chris Vernon

Natural Gas - A Tale of Two Markets by Nate Hagens

A Closer Look At Oil Futures by Nate Hagens

Our World Is Finite: The Implications of Resource Limitations

Posted by Gail Tverberg on "the oil drum"

We all know the world is finite. The number of atoms is finite, and these atoms combine to form a finite number of molecules. The mix of molecules may change over time, but in total, the number of molecules is also finite.

We also know that growth is central to our way of life. Businesses are expected to grow. Every day new businesses are formed and new products are developed. The world population is also growing, so all this adds up to a huge utilization of resources.

At some point, growth in resource utilization must collide with the fact that the world is finite. We have grown up thinking that the world is so large that limits will never be an issue. But now, we are starting to bump up against limits.

What are earth's limits? Are we reaching them?

ED Note by PG: Note that this is an updated version of an article that was run about six months ago. With all of the new folks (Welcome!) around, it seemed like a good time for an article like this. We appreciate your sharing this and all the work from The Oil Drum with the people you care about.

1. Oil

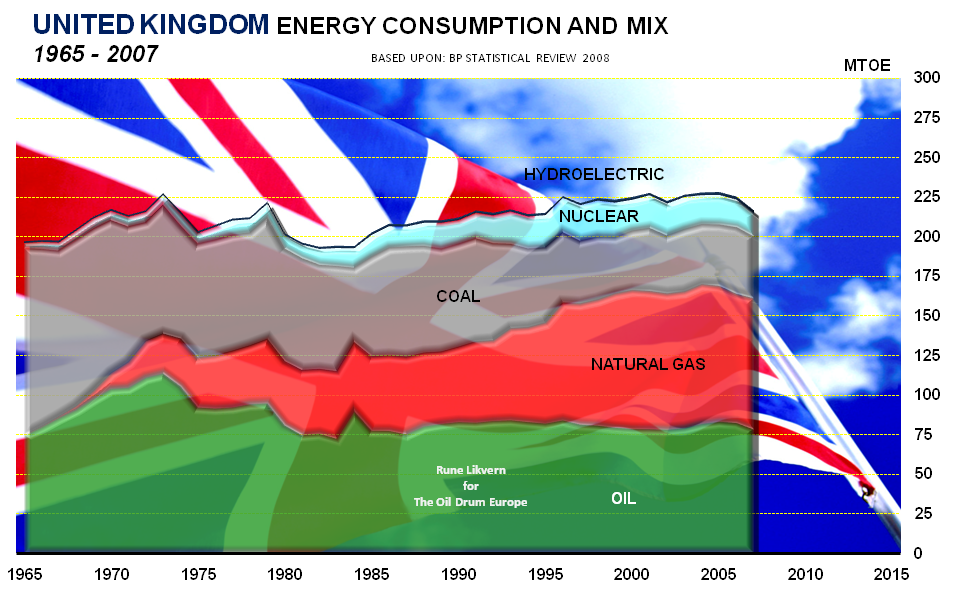
Oil is a finite resource, since it is no longer being formed (at least in any meaningful quantity). Oil production in a given area tends to increase for a time, then begins to decline, as geological limits are reached. Oil production in the United States and north sea has followed this pattern.

Decline in both the United States and the North Sea took place in spite of technology improvements. There is now serious concern that world oil production will begin to decline ("peak"), just as it has in the United States and the North Sea.

The US Government Accountability Office studied this issue, and issued are report in the spring of 2007 titled CRUDE OIL: Uncertainty about Future Supply Makes It Important to Develop a Strategy for Addressing a Peak and Decline in Oil Production. The US Department of Energy also asked the National Petroleum Council to look into this issue. Its report, Facing Hard Truths about Energy, further confirms the importance of this issue.

Exactly how soon the decline in oil production will begin is not certain, but many predict that the decline may begin within the next few years. There is even some evidence that the decline may have begun in 2005.

Even if oil production were not to decline, but simply remain level, there is sufficiently strong growth in demand that the shortfall would be a serious issue. Matt Simmons talks about this issue in his talk at the Houston meeting of the Association for the Study of Peak Oil. Also, a recent report called Lighting the Way: Toward a Sustainable Energy Future by the Interacademy Council states:

Overwhelming scientific evidence shows that current energy trends are unsustainable.
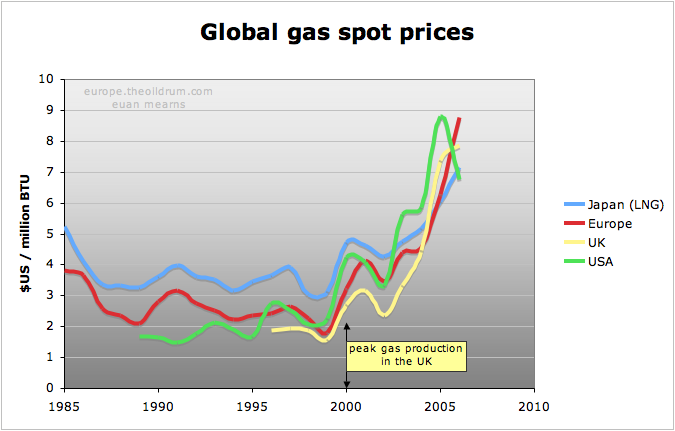
2. Natural Gas

Natural gas in North America is also reaching its limits. United States natural gas production reached its peak in 1973. Each year, more and more wells are drilled, but the average amount of gas produced per well declines. This occurs because the best sites were developed first, and the later sites are more marginal. The United States has been importing more and more natural gas from Canada, but Canadian production is beginning to decline as well. Because of these issues, the total amount of natural gas available to the United States is likely to decline in the next few years - quite possibly leading to shortages.

3. Fresh Water

Fresh water is needed for drinking and irrigation, but here too we are reaching limits. Water from melting ice caps is declining in quantity because of global warming. Water is being pumped from aquifers much faster than it is being replaced, and water tables are dropping by one to three meters a year in many areas. Some rivers, especially in China and Australia, are close to dry because of diversion for agriculture and a warming climate. In the United States, water limitations are especially important in the Southwest and in the more arid part of the Plains States.

4. Top soil

The topsoil we depend on for agriculture is created very slowly - about one inch in 300 to 500 years, depending on the location. The extensive tilling of the earth's soil that is now being done results in many stresses on this topsoil, including erosion, loss of organic matter, and chemical degradation. Frequent irrigation often results in salination, as well. As society tries to feed more and more people, and produce biofuel as well, there is pressure to push soil to its limits--use land in areas subject to erosion; use more and more fertilizer, herbicides, and pesticides; and remove the organic material needed to build up the soil.

Are there indirect impacts as well?

Besides depleting oil, natural gas, fresh water, and top soil, the intensive use of the earth's resources is resulting in pollution of air and water, and appears to be contributing to global warming as well.

Can technology overcome these finite world issues?

While we have been trying to develop solutions, success has been limited to date. When we have tried to find substitutes, we have mostly managed to trade one problem for another:

Ethanol from corn
Current production methods usually require large amounts of natural gas and fresh water, both of which are in short supply. Increasing production may require the use of land which has been set aside in the Conservation Reserve Program because of its tendency to erode. The amount if ethanol produced is tiny compared to our fuel need, but still drives up the cost of all types of food.

Oil from oil sands and oil shale
Oil from oil sands requires large energy inputs, currently from natural gas, as well as fresh water, and creates pollution issues. Oil from oil shale is expected to require even more energy and fresh water.

Coal to liquid and coal substitution for natural gas
"Clean coal" and sequestration of carbon dioxide from coal are not yet commercially available, and are expected to be very expensive if they become available. Thus, coal production is likely to exacerbate global warming and raise pollution levels. If coal is used to replace both oil and natural gas, it is likely to deplete within a few decades, like the natural gas and oil it replaces.

Deeper wells for fresh water
If deeper wells are used, they will requires more energy to pump the water farther. In locations that use aquifers that replenish over thousands of years, the available water will eventually be depleted.

There are a number of promising technologies — including solar, wind, wave power, and geothermal — but the amount of energy from these sources is tiny at this time. Nuclear power also seems to have promise, but has toxic waste issues and is difficult to scale up quickly. A general introduction to alternative technologies is provided in What Are Our Alternatives If Fossil Fuels Are a Problem?

What if we don't find technological solutions?

We can't know for sure what will happen, but these are some hypotheses:

1. Initially, higher prices for energy and food items and a major recession.

If the supply of oil lags behind demand, we can expect rising prices for oil and gasoline and possibly other types of energy. Prices for food may also rise, because oil is used in the production and transportation of food. Recession is likely to follow, because people will cut down on their purchases of discretionary items, so as to be able to afford the necessities. Layoffs will follow. People laid off will find it difficult to pay mortgages and other debt, so banks and other creditors will find themselves in increasing financial difficulty.

2. Longer term, a decline in economic activity.

With fewer resources, economic activity is likely to decline. We will need to find replacements for many products in a relatively short time frame — heating fuel, transportation fuel, plastics, synthetic fabrics, fertilizer (currently made from natural gas), and asphalt, among other things. Living standards are likely to drop, because we don’t have infinite resources for replacing all the things that are declining in availability.

A graphic representation of how this might happen is shown in Figure 3. Real gross domestic product (GDP) gives a measure of how much goods and services the United States is producing in a year, in constant (year 2000) dollars. The 3 per cent trend line in Figure 3 shows the expected growth in real GDP, if growth continues as in the past. Scenarios 1 and 2 show two examples of how limitations on oil and natural gas might impact future real GDP. Scenario 1 shows a fairly rapid decline, starting very soon. Scenario 2 shows a slower decline, starting in 2020. If the downturn is still several years away, we have longer to plan, and a better chance that the decline will be more gradual.

3. Transportation difficulties and electrical outages.

Since transportation generally uses petroleum products for fuel, a reduction in the amount of oil available is likely to cause transportation difficulties. These difficulties may extend to all forms of transportation--automobile, trucks, airplanes, boats, and railroads, to the extent that fuel is unavailable due to shortages, cost, or rationing.

If natural gas supplies decline, electrical outages are likely, especially during high-use times of the year. Electrical outages may also result from interruption of transportation of other fuel, such as coal, to power plants, because of petroleum shortages. Outages may be one time events, or may be planned outages at certain times of the day, to compensate for an inadequacy in the fuel supply.

4. Possible collapse of the monetary system.

This is perhaps the biggest single issue, and the most difficult to understand.

There is a huge amount of debt in the world today. When loans were made, the expectation of the lenders was that the economy would continue to grow as in the past--that is like the 3 percent trend line in Figure 3 above. If this continued growth occurred, people, on average, would be a little better off financially when the time came to pay off their loans than they were when the loans were taken out, so they would have a reasonable chance of paying off the loans with interest. Corporations would continue to grow, and because of this continued growth, most would be able to pay off their debt with interest.

What happens if a scenario like that shown as Scenario 1 or Scenario 2 on Figure 3 occurs? When it comes time to repay the loans, people and corporations will be on average, worse off, rather than better off, than when they took them out. It is likely that many people will be unemployed, and cannot pay back their debt. Companies manufacturing goods that are no longer in demand are likely to be bankrupt, and thus will be unable to repay their debt. Organizations holding this debt, such as banks, insurance companies, and pension funds will find themselves in financial difficulty, because of the many defaults on the loans that are the assets of these organizations.

Two possible outcomes of widespread defaults come to mind. One is that there is so much debt that cannot be repaid that banks, insurance companies, and in fact the whole monetary system fails. The other alternative is that the government guarantees all the debt, so that the institutions do not fail. The latter approach would likely lead to hyper-inflation.

In either event, people and businesses would lose their savings, because money either would either be no longer available (first approach), or would be worth very little due to inflation (second approach). In either event, foreign countries would be unlikely to accept our currency in trade. Simple transactions, such as purchasing food or paying an employee, would become very difficult. Eventually, some approach would likely be found to circumvent these difficulties--perhaps a more barter-based approach--but this would be a huge change from our current system.

5. Failure of economic assumptions to hold.

We have been raised in a world where supply and demand are generally in balance. An increase in demand results in a greater price, which in turn leads to a greater supply. If the particular item isn’t available, substitution is generally available.

Once we reach geological limits, these basic principles seem much less likely to hold. An increase in energy demand isn't likely to translate into greater supply. Distribution of the limited available supply seems likely to reflect considerations other than price, such as rationing and long-term alliances. There may also be military conflict over available supplies.

I talk more about the economic implications of peak oil in a three part series: Part 1, Part 2, and Part 3.

6. Changed emphasis to more local production.

Two factors are likely to encourage local production and discourage international trade. One is the higher cost and/or unavailability of fuels used for transportation. The other is difficulty with the monetary system--either hyper-inflation or complete failure of the system. If there are monetary system problems, other countries are likely to want actual goods in trade, rather than IOUs or money. This requirement is likely to greatly reduce the amount of trade with foreign countries.

Food production is likely to be more localized, since this insures a continuous supply, and reduces the amount of fuel needed for transportation. If there are problems with shortages, people may choose to have gardens, so as to grow a few of the foods they need themselves.

7. Reduced emphasis on debt.

Once it is clear that future production is likely to be less than current production, as in either Scenario 1 or Scenario 2 of Figure 3, it will be very difficult to find any lender willing to provide long term loans, since if the loan is paid back at all, it is likely to be paid back in money that is worth very much less than it was at the time the loan was taken out.

If governments still have debt at this point, they will find it difficult to sell new bonds to replace the ones that mature. Businesses desiring to build new plants may find it necessary to accumulate resources for new plants in advance of their construction. Mortgages may not be available for prospective home owners, either.

8. Reduced emphasis on insurance and pensions.

If there are difficulties with the monetary system, insurance companies and pension plans will be among the hardest hit, since thy take in funds and invest them, and pay benefits later.

It is possible that a limited form of Social Security coverage may continue, but this is by no means certain. If a high level of inflation occurs (see point 4 above), benefits that have been promised to date will be worth very little. If a new monetary system is in place, it will be up to the government at that time to determine the level of benefits. Because total goods and services will be lower in the future (Figure 3 above), benefits to retirees will almost certainly be lower as well.

9. More people will perform manual labor.

As the amount of oil and natural gas becomes less available, more work will need to be done by hand, since the fuels to run machines will be less available. In order to encourage people to take jobs involving manual labor, manual labor will pay better in relationship to desk jobs. Because food is such an important commodity, farming may be particularly highly valued, and may pay especially well.

10. Resource wars and migration conflicts.

If there is is an inadequate amount of a resource (water, oil, natural gas, or food), countries may fight over the limited supplies that are available. Conflicts are likely to spring up regarding areas where resources are plentiful.

Alternatively, people may choose to migrate from an area if resources become less abundant--for example, migration may occur if water supplies dry up, or if land is flooded due to global warming, or if declining oil supplies limit transportation. Receiving areas may not welcome the newcomers, leading to more conflict.

11. Changes in family relationships.

Families are likely to see more of each other, because of reduced transportation availability. Families may work more closely together, tending gardens and running small family businesses. Co-operation may be more highly valued by society. Divorce rates may decline.

12. Eventual population decline.

The food supply produced in the world today is many times greater than the food supply 100 years ago, before oil and natural gas were used in tilling crops, pumping water for irrigation, making fertilizer and pesticides, and transporting food to market. As oil and natural gas become less available, the food supply is likely to decline. Eventually, world population is also likely to decline, reflecting the lower food supply.

Conclusion

We cannot know exactly what the future will hold, if technology is not able to overcome the many issues associated with a finite world, including declining oil and natural gas supply, decreasing fresh water supply, and climate change. Whatever changes occur are likely to differ from location to location, as the world activity becomes more localized.

We tend to think of governments as fairly stable, but these too may change. Countries may subdivide into smaller units. Some have even suggested that groups of states may break away from the United States.

Educational institutions will most likely change. Fewer students will probably attend colleges and universities, and the subjects of interest will likely change. The sciences and agriculture or permaculture are likely to be topics of interest. More students may want to live on campus, if transportation is a problem. Adult education may become more important, as people seek to develop skills for a changing world.

Businesses will also change. Local businesses will become more important, while multinational companies recede in importance. Manufacturing will become less important, and recycling will become more important. Providing necessities will get top priority, while nice-to-have items will not sell well. Barter, or a new monetary system that substitutes for barter, may be the way business is done.

People may choose to live closer to work, or may work at home, so as to minimize costs associated with commuting. Some people may choose to live with relatives or friends, so as to save on utility costs. Eventually, many homes in undesirable locations may be left empty, and the parts of these unoccupied homes that can be used elsewhere will be recycled.

The next 50 years will certainly be interesting ones. Perhaps, with technological advances, some of the potential problems can be avoided. But we will need to work hard, starting now, to develop ways to work around the problems which seem to be ahead.

To Learn More

The Power of Community: How Cuba Survived Peak Oil 53 minute film, available for $20, tells the story of how Cuba adapted to losing over half of its petroleum imports after the collapse of the Soviet Union.

Closing the Collapse Gap: The USSR Was Better Prepared for Peak Oil than the United States Humorous talk by Dmitry Orlov

The Long Emergency: Surviving the End of Oil, Climate Change, and Other Converging Catastrophes of the Twenty-First Century Book by James Howard Kunstler

Discussion Questions

1. What are five things that might improve after world oil production begins to decline? (Hint: Consider exercise, weight problems, family situations, etc.)

2. If there is a decline in oil and gas production, how do you expect the large amount of debt outstanding to resolve itself? Do you think there will be monetary collapse, hyper-inflation, or some other solution?

3. Do you expect that families will have more or fewer children after oil and natural gas production begin to decline? Why?

4. How can businesses prepare for interruptions in electrical service?

5. What types of buildings are best adapted to frequent outages of electrical service? Which buildings are likely to have the most problems?

6. What vocations appear to be most likely to be useful for supporting a family, after oil and gas production begin to decline?

7. What changes might a college make to its curriculum, to better prepare students for the changing world situation expected after production of oil and natural gas begin to decline?

8. In Figure 3, real GDP in Scenarios 1 and 2 are shown as changing in relatively straight lines. Could alternative scenarios have the lines zig-zag or drop suddenly? What real world situations might cause different patterns?