Posted by Chris Vernon on June 24, 2008 - 9:40am in The Oil Drum: Europe
Topic: Supply/Production
Tags: gas, gas prices, north sea, united kingdom [list all tags]
| | This is a guest post from Rune Likvern (nrgyman2000 on The Oil Drum). Rune is an independent energy and financial analyst from Norway who has decades of experience from holding various positions within several international oil companies and also runs a blog called "Kveldssong for Hydrokarbonar". When Rune posts on The Oil Drum we usually pay attention to what he has to say. |
This post presents the development of the energy mix for UK, how UK in less than a decade went from being a substantial energy exporter to a substantial net energy importer. A more detailed look on what to expect for UK natural gas prices in the near term and a brief discussion on the real options available for future UK energy consumption.
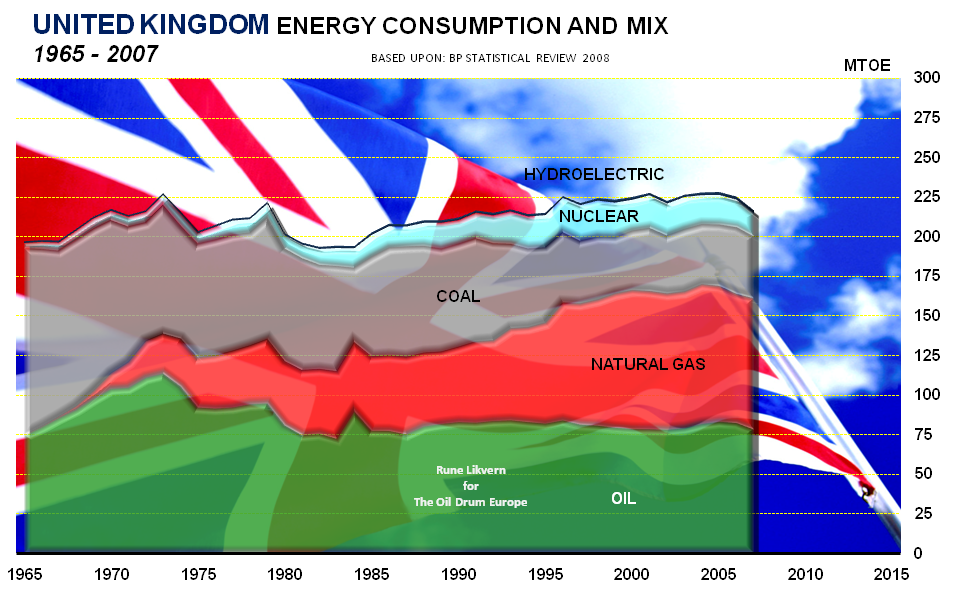
The UK development in energy consumption and energy mix for the years 1965 - 2007 in MTOE. Click to enlarge.
(MTOE; Million Ton Oil Equivalents; 1 MTOE approximates 20 000 bbl/d (oil))
In 2007 UK consumed close to 2% of the global total primary energy consumption.
There are few countries where natural gas constitutes such a huge part of the energy consumption. In the recent years natural gas has made up 36 - 38% of UK primary energy consumption (in the US natural gas constitutes 25% of the total primary energy consumption). Among the countries with considerable energy consumption, only in Russia has natural gas a higher relative part (above 50%) of the total energy consumption. (Russia is now listed to have more than 25% of global remaining recoverable natural gas reserves.)
If time (and the TOD editors) permit I will in a future post look into the real possibilities of filling the emerging UK natural gas supply gap with natural gas from Netherlands, Norway, Russia and LNG which for the medium term (meaning the next ten years) seems to be the most viable future supply sources. This will be depressing reading (if you live in UK), so don’t say you were NOT warned!
The recent decline in UK oil consumption is thought to be related to the recent oil price increases. Natural gas consumption is sensitive to weather (temperature), which means heating requirements, and of course a competitive price.
I am in the process of drafting a post for TOD Europe comparing the development in energy/oil consumption and production for the G-7 countries (Canada, France, Germany, Italy, Japan, UK and US) and the BRIC (Brazil, Russia, India and China) members. One of the interesting observations from this study, so far, is that it looks like the G-7 countries oil consumption is very sensitive to relative high upward price movements of oil, like in the 70’s and 80’s and now most recently.
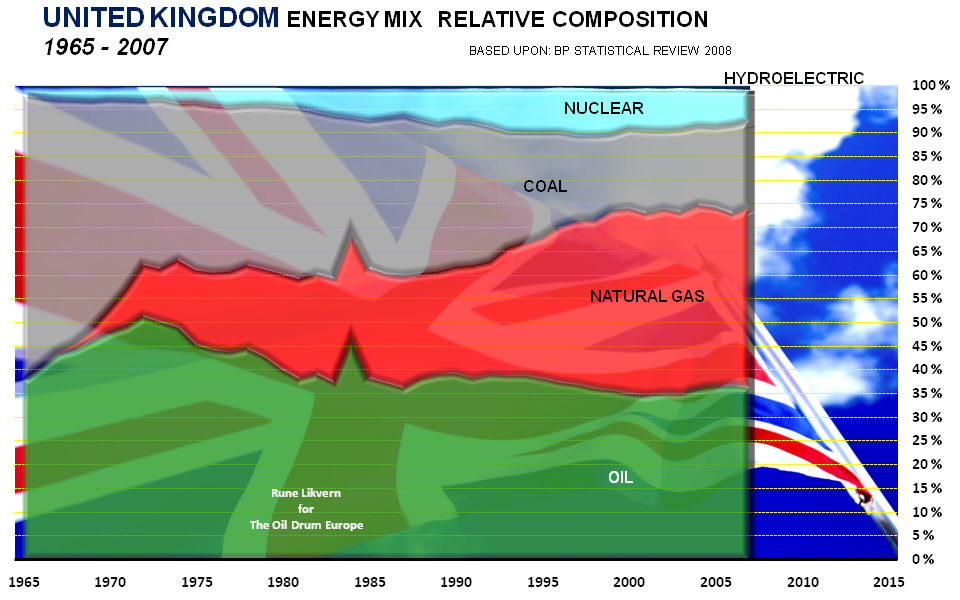
The UK development in energy consumption and energy mix for the years 1965 - 2007 in MTOE. Click to enlarge.
(MTOE; Million Ton Oil Equivalents; 1 MTOE approximates 20 000 bbl/d (oil))
The above diagram shows the relative development of primary energy sources within the energy mix for the years 1965 - 2007 for UK. Back in 1965 coal was the main energy source for UK delivering around 60% of the primary energy consumption. Over the years coal has gradually been substituted with mainly natural gas and nuclear and presently coal makes up less than 20% of total UK primary energy consumption.
UK FROM NET ENERGY EXPORTER TO NET IMPORTER
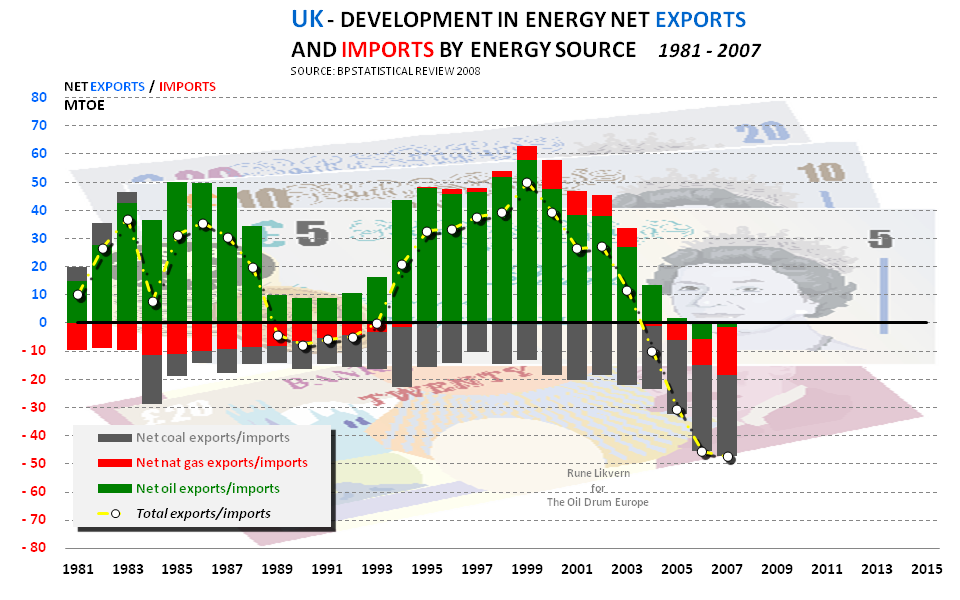
The development in net energy exports and imports split on energy sources for UK for the years 1981 - 2007 in MTOE. Click to enlarge.
(MTOE; Million Ton Oil Equivalents; 1 MTOE approximates 20 000 bbl/d (oil))
Through a period of 25 years the UK was a net oil exporter, which peaked with the production in 1999. 6 years later, in 2005, UK again became a net oil importer and the UK oil production from the North Sea is now generally thought to be in irreversible decline (with expected decline rates of 8 - 10% annually), suggesting future growth in oil imports if consumption stays at present levels. Even if indigenous supplies of oil are in decline, this may be overcome with a combination of increased imports and improved efficiencies in the use of oil.
The real near term challenge to UK energy supplies is identified to be natural gas supplies.
Natural gas has since the early 70’s become the most dominant UK primary energy source based upon indigenous supplies. The UK was a net exporter of natural gas (to Continental Europe) from 1995 - 2003. UK natural gas production peaked in 2000 and the UK again became a net natural gas importer as of 2004 and in 2007 UK net imports was more than 20% of its natural gas consumption.
In 1984 UK became a net importer of coal. UK coal reserves is listed to have a R/P ratio of 9 according to BP Statistical Review 2008, meaning that present reserves will last in 9 years at present rate of production.
NATURAL GAS AND OIL PRICES
It is generally observed (and acknowledged) that natural gas prices tend to follow the path of the oil prices with a time lag. Some analysts have even predicted that natural gas prices could decouple from oil prices sometime in the future.Studying the price ratio of nat gas versus oil on a heating value basis (per million Btu) tells an interesting story.
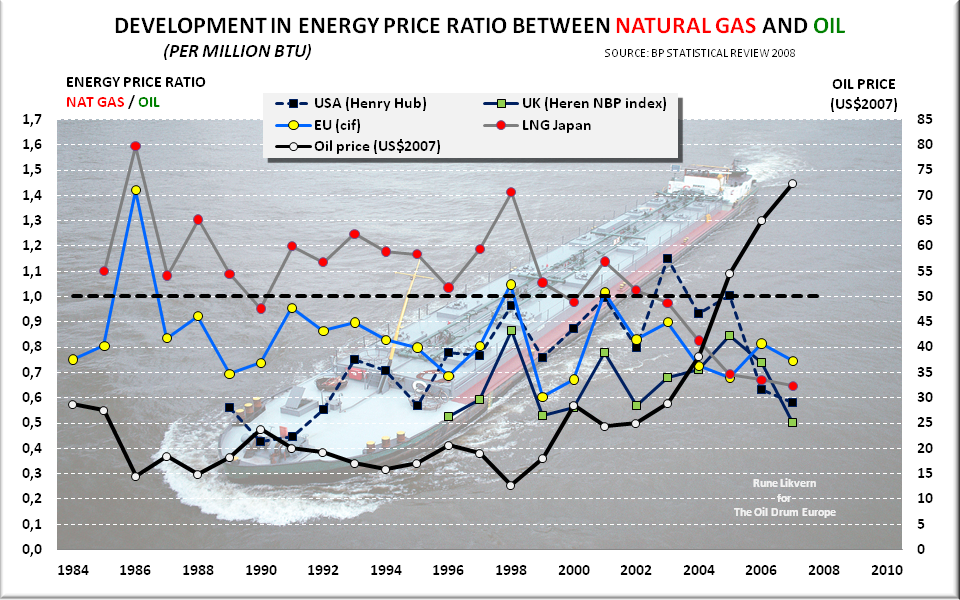
The development in the price ratio between natural gas and oil. Click to enlarge.
The above diagram shows the development in the price ratio between natural gas and oil against the left y-axis for;
- LNG (delivered in Japan)
- Natural gas (cif) delivered to EU
- Natural gas at Henry Hub (USA)
- Natural gas at Heren NBP (National balancing Point) UK
When the energy price ratio is below 1.0 this indicates that natural gas based on energy is cheaper than oil and vice versa when this ratio becomes greater than 1.0.
Japan seems recently to increasingly profit from the run up in oil prices as LNG purchased on long term contracts becomes relatively cheaper as a source of energy based on heat content. Developers of LNG facilities generally preferred long term contracts due to the capital intensive nature of the LNG business as this also increases the predictability for return on the investment and a steady profit flow. This is also one of the reasons why it has been challenging to establish a well functioning spot market for LNG.
Historically, and for those of the readers who are interested, 1 (one) barrel of oil has been converted to approximately 6 (six) million Btu of natural gas based on price. This means that if oil is priced at US$132/bbl, 1 million Btu of natural gas should be expected to cost US$22 at the trading point or beach.
(1 000 000 Btu = 10 Therm; 1 Therm = 100 000 Btu)
The diagram illustrates that the recent years run up in oil prices, as from 2004, have made natural gas increasingly and relatively cheaper than oil (in the diagram it can be observed how the hurricanes Katrina and Rita affected US natural gas prices in absolute terms and relative to oil in 2005). Note also how natural gas became relatively expensive as oil prices fell.
So far in 2008 the recent runs up in the oil prices have further encouraged an increase in the demand for natural gas. The result from this demand growth may now be observed in the recent price increases for natural gas at trading points like Henry Hub (USA) and NBP (UK)
Consumers who have dual fuel capabilities (like electrical power plants normally used for peak shaving) will tend to alternate between natural gas and distillates based on price.
The UK was a net exporter of natural gas form the years 1995 to 2003 (ref the diagram above illustrating the development for UK as a net energy exporter and net energy importer) and how this increased with the opening of the Interconnector between Bacton and Zebrugge in Belgium in 1998.
For UK owners of natural gas the liquid market of Continental Europe was in close reach and prices on the beach on Continental Europe was on average 20% higher than in the UK (ref the above diagram) and serving this market did not pose any big technical challenges, financial or political risks.
The lower nat gas prices at the beach for UK domestic users, both household and industrial, also gave UK industry a competitive edge (relative to consumers in Continental Europe and even in the US) and made comfortable amounts of energy available and affordable for households.
WHERE IS UK NATURAL GAS PRICES HEADED AND WHY
In 2007 the UK natural gas market became flooded with natural gas thus depressing prices. This flood of natural gas resulted from several sellers, like Norway, Holland (BBL) and LNG traders, had perceived an increased tightness in the UK market (due to declines in UK indigenous supplies and expected growth in consumption) for the heating season 2006/2007 and positioned them to reap the profits from this tightness. What happened, as these players seems to have been unaware of each other (which should be the case in an ideal liberalized marketplace), was that supply increased more than demand grew and in addition the weather became milder than normal, a combination and a recipe for depressing natural gas prices.UK will increasingly have to cover their natural gas consumption through imports, which suggests that an era of cheap natural gas, which has also acted as a competitive edge, increasingly will have to become harmonized with natural gas prices on Continental Europe which UK increasingly will have to bid against to secure supplies. Indirectly this may now be observed as less natural gas is exported to Continental Europe in the summer months through the Interconnector.
- With reference to the diagram showing the development in the energy price ratio between natural gas and oil and establishing a reference to 2007 levels, further assuming harmonization against natural gas prices on Continental Europe, this should suggest that nat gas prices in the UK at the beach has to come up 50 - 60% relative to 2007 levels. On average in 2007 these prices were 30 p/therm at the beach (the natural gas price has huge seasonal swings).
- Oil prices in 2007 was on average above US$72/bbl, and so far in 2008 the average oil price has been close to US$110/bbl and recently it seems like it has found support at US$130 - 140/bbl. This now suggests that the natural gas prices should put on an additional 80 - 90%.
It is difficult to predict the weather for the upcoming heating season and this is often the one factor having the greatest effect on short term natural gas prices. Given the seasonal nature of natural gas consumption it should come as no surprise if UK natural gas prices at the beach move north of 100 p/therm before the upcoming Christmas.
SUMMARY
In this post it has been shown why UK households and industries should expect to increasingly be hammered by growing energy prices.In less than ten years UK went from being a considerable energy exporter to becoming in size a similar energy importer. In 2007 UK imported more than 20% of its energy needs. This import is now forecast to grow at an annual rate of 13 - 15 MTOE (250 - 300 kboe/d; kilo barrels of oil equivalents a day) or 6 - 8% in the years ahead. What makes UK such an interesting subject from an energy standpoint is that the UK has had to transit from a major energy exporter to an energy importer with a speed never seen before for any other comparable economy. There are economies that are and have been more reliant on energy imports than UK (like Germany, France, Italy, Japan to name a few) and these have from these realities developed (seemingly) long term successful strategies involving central government’s involvement to cope with this energy reality.
This post has further shown that the UK energy mix is dominated by natural gas and thus made it vulnerable for potential future supply crunches. To revise the energy mix is a time consuming process and if the world has passed, is on or close to its apex for liquid energy supplies, these will not constitute a sustainable alternative to natural gas for the UK energy mix.
I have been informed that after a coal mine has been closed it may take ten years to recommission it for operations. Coal is mainly used for electricity generation and could of course be used for both heating and cooking purposes, which suggests changing housing appliances and stoves to accommodate this. To base the future UK energy mix on more coal results in future growth in coal imports.
Nuclear energy comes with delicate political maneuvering as the public needs to familiar itself with this alternative. Further needs nuclear plants a lead/construction time of approximately 10 years from approval have been granted.
I have not presented anything about renewables.
(I consequently refuse to use the expression “renewable energy”, as people who are familiar with the laws of thermodynamics know that energy by nature is NOT renewable. Energy may be transformed from one form into another.)
So called renewables will play a role in the future energy mix, but their impact on energy supplies must realistically be viewed against the potent and versatile nature of oil and natural gas.
Like USA talks about its oil addiction it looks like UK needs to talk about its natural gas addiction.
Given the time frame and not least options available to redesign the UK energy mix it looks like the UK “energy supply war” may have been lost before most people became aware that there was one on.
Nature enforces its own limits and a realistic look on the future energy options available for UK, energy conservation and power down now seems the most likely. This is of course a harsh message for any politician to convey to the public as it requires talent and leadership which there generally seems to be a universal deficit of......even in good times.
No comments:
Post a Comment